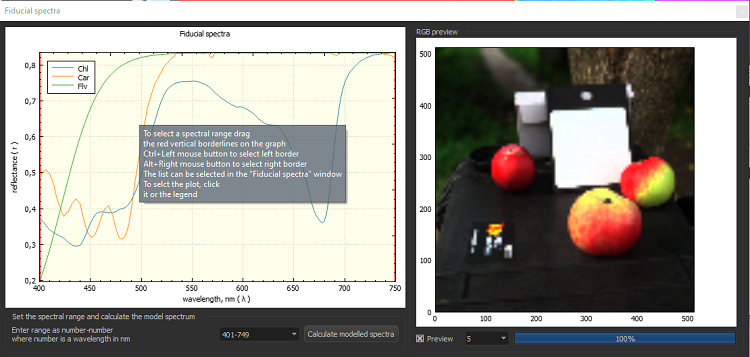
The «Fiducial spectra calculator» window is used for displaying the fiducial spectra and previews of the fitting operation result.
The displayed fiducial spectra are managed thru the list in the «Fiducial spectra calculator» window.
The fitting bundle is produced for the user-selected fiducial spectra and spectral range. The fiducial spectra are selected in the «Fiducial spectra calculator» window. The spectral range is selected by dragging the vertical lines in the «Fiducial spectra calculator» window.

For express selecting the left or right limits of the spectral range, use <Ctrl> + left click or <Alt > + left click.
Click on the legend in the top part of the «Fiducial spectra calculator» filed selects and highlights a fiducial spectrum.
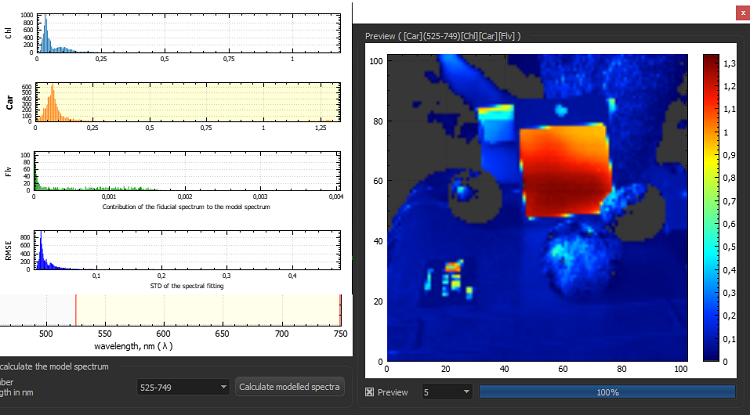
The previously selected spectral ranges can be reused by selecting them from the drop-down list in the middle-bottom part of the window. Checking «Preview» checkbox enables calculation of the preview for the results of the fitting. The preview quality is selected in the dropdown at the bottom, it ranges from 2 (most precise, slowest) to 10 (most coarse, fastest). After preview calculation, the list of calculated histograms appears in the top right part of the window. These histograms allow to estimate the quality of the results for specific combination of the fiducial spectra in the particular spectral range. Click on the histogram opens the corresponding index image from the fitting bundle. The “Preview” window can be moved with mouse or zoomed with mouse wheel. After calculating a preview, a shortcut for image selection from the bundle becomes active.

After obtaining a preview of satisfactory quality, you can do the complete calculations by clicking the «Fit» button. When the calculation completes, the resulting fitting bundle will appear in the «Fitting bundles» window and the main image will switch to the RGB mode. Items in the «Fitting bundles» window are directly selectable with the mouse.
The shortcut menu items for the «Fiducial spectra» window:
- Save fiducial spectra image… saves image of the spectral curve plot to PNG, JPG, or PDF file written by default to the Working folder.
- Save fiducial spectra to CSV… saves the numerical representation of the fiducial spectra to Excel *.csv file written by default to the Working folder.