
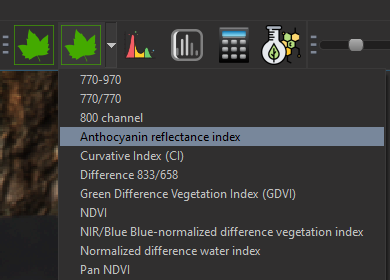
To calculated image using a new index and to add the index to the list in the window «Add index image» fill out the fields «Index name», «Index formula», and click «Ок». The newly entered index will appear in the Quick Index list it this index is different from the indexes that are already on this list.
The Notes field displays the information about the spectrometer and a sample index formula.
To calculate an image based on the selected index click «Indexes…» or Quick Index or the Index button on the toolbar.
«Spectrum» window displays current spectrum. To scale of X and Y axes, drag or mouse wheel. The window displays the current ROI name, number of its pixels, average spectrum, and its STD (not valid for the point-type ROIs).
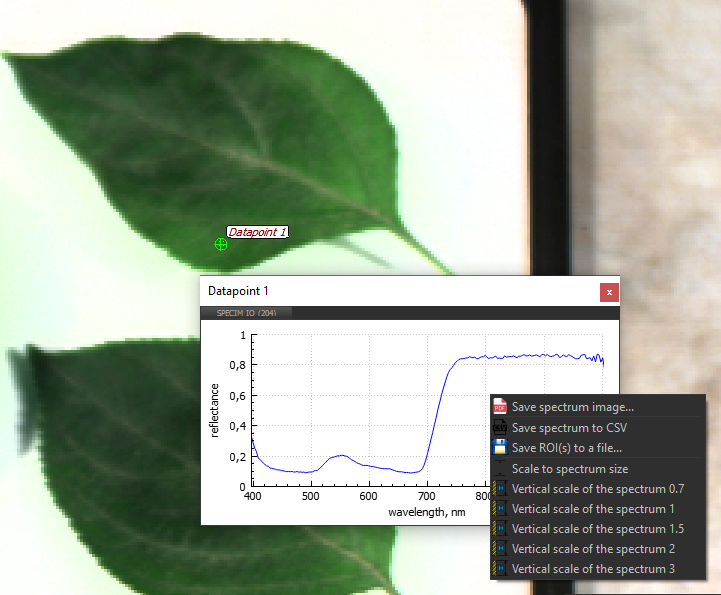
Shortcut menu items:
- Save as image… saves the image of the spectrum as PDF, PNG, or JPG.
- Save to Excel *.csv… saves the editable spectrum as Excel CSV.
- Save ROI as *.roi… saves ROI for this spectrum to a ROI. file. The ROI files are special format for storing ROI-related information so the ROI can be restored later.
- Fit to window scales the spectrum to fit it into the Spectrum window size.
- Vertical scale 0.7 sets the vertical scale to 0.7.
- Vertical scale 1 sets the vertical scale to 1.
- Vertical scale 1.5 sets the vertical scale to 1.5.
- Vertical scale 2 sets the vertical scale to 2.
- Vertical scale 3 sets the vertical scale to 3.
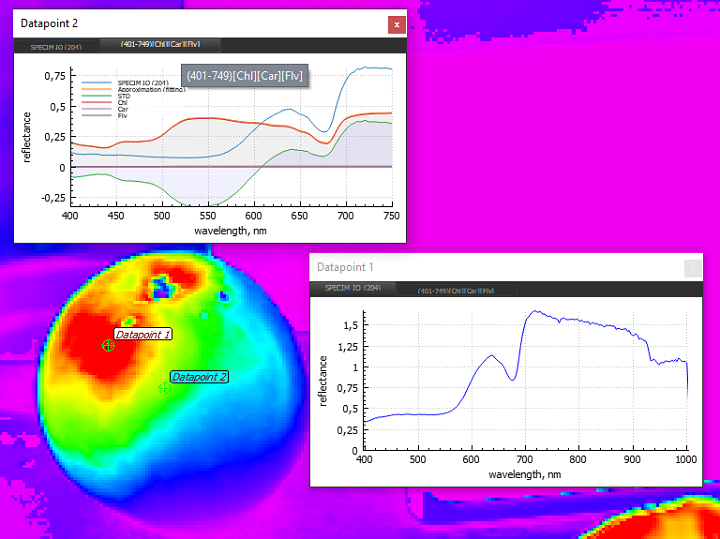
The window at the top has a menu bar that allows you to switch to viewing modes like a spectrum, received by the device, for example, “Specim IQ”, the spectrum of which is always displayed in the left menu item, and the fitting profiles contributions of various standards obtained during the execution of racsets in «Fiducial spectra calculator» window.
When choosing the mode of displaying the results of calculation of fitting packages, the window has a context menu:
- Save spectrum image… saves the image of the spectrum and fitting profiles as PDF, PNG, JPG.
- Scale to spectrum size sets the vertical scale to the spectrum.
- Scale to fitting results sets the vertical scale to fitting profiles.
- Save the ROI with fitting results to PDF or CSV customizable ability to batch save a list of ROIs in graphic and text formats.
Important: When moving the ROI «point» type in the window, the spectrum are changed, scaled to fitting profiles, but if the “Shift” key is pressed while moving, then the scaling will be carried out according to the spectrum.
Switching in all ROI windows to the mode «spectrum» available in the context menu «Fitting bundles» window.
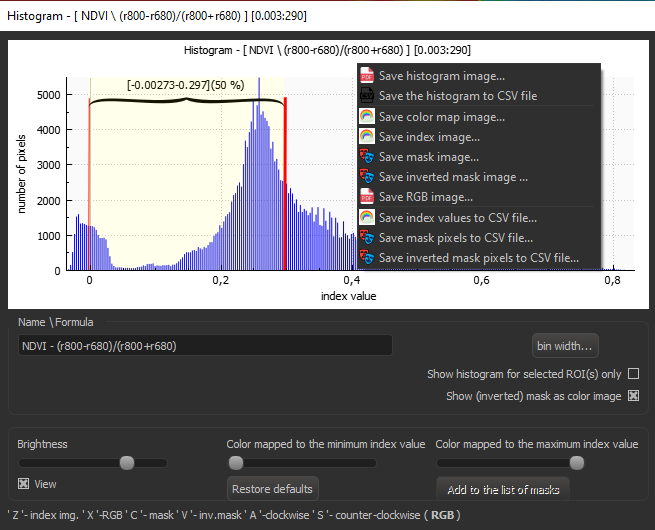
The «Histogram» window is used for displaying of the histogram for the entire image of the ROI(s) selected in the «Images» window.
In the header of the window, the following information is displayed, for example: «Histogram - [Difference 833/658 r833-r658][0.004:317]», where «Difference 833/658» - is a sample index name, «r833-r658» - the sample index formula, «0.004:317» - the class interval and the total number of the classes in the histogram.
In the upper left part of the window, the histogram is displayed with a duplicate header line and vertical lines showing max/min thresholds. These thresholds define the index value range displayed as the index images in the center (area#1, the color map) or at the right (area#2) of the Histogram window.
On hovering over the vertical threshold lines, the mouse pointer changes so you can drag the threshold lines to adjust the clipping limits. These changes are reflected in the numeric labels located above e.g. [-0.107-0.166](24%), where «-0.107-0.166» are the lower and upper limits, and «24%» is the proportion of the total datapoints represented on the histogram within the current limits.
In the left, there is the «Name Formula» set of controls including:
- mask name field (used for saving the mask);
- the checkbox «Show histogram only for selected ROI(s)»—toggles the histogram calculation mode;
- the checkbox «Show color mask/inverted mask»—toggles color vs. black and white mask image modes;
- the «Interval…» button—sets width of the class interval and total number of the classes for the histogram. To check the adjustments, click «Apply», to finish click «ОК»;
- the slider «Brightness» controls brightness of the image shown in the area#2;
- the slider «Min. index color mapping» controls color bar of the image shown in the area#2;
- the slider «Max. index color mapping» controls color bar of the image shown in the area#2;
- the button «Reset» brigs back the default min/max values of the index and shows all datapoints (100%) on the histogram;
- the button «Add to mask list» saves the current mask image (or inverted mask image, if enabled for the area#2 by the option «Mask»/«Inv. mask»);
- Hints on the hotkeys for the area#2 (the keys «Z», «X», «C», «V», «A», «S»);

The shortcut menu items for the histogram:
- Save histogram image… saves the image of the histogram as PNG, JPG, or BMP file written by default to the Working folder.
- Save histogram as Excel *.csv… saves a numeric representation of the histogram to an Excel *.csv file by default written to the Working folder.
- Save colormap image… saves the false-colored image from the area#1 of the Histogram window as PNG, JPG, or BMP file written by default to the Working folder.
- Save index image… saves the index image from the area#2 of the Histogram window to PDF, PNG, JPG, or BMP file written by default to the Working folder.
- Save mask image… saves the mask image from the area#2 of the Histogram window to PNG, JPG, BMP file written by default to the Working folder.
- Save inv. mask image… saves the inverted mask image from the area#2 of the Histogram window to PNG, JPG, or BMP file written by default to the Working folder.
- Save RGB image… saves the natural-colored image from the area#2 of the Histogram window to PNG, JPG, or BMP file written by default to the Working folder.
- Save index to Excel *.csv… saves the numeric representation of the index image to Excel *.csv file written by default to the Working folder.
- Save mask to Excel *.csv… saves the numeric representation of the mask image to Excel *.csv file written by default to the Working folder.
- Save inv. mask to Excel *.csv… saves the numeric representation of the inverted mask image to Excel *.csv file written by default to the Working folder.
The «Fiducial spectra calculator» window is used for displaying the fiducial spectra and previews of the fitting operation result.
The displayed fiducial spectra are managed thru the list in the «Fiducial spectra calculator» window.
The fitting bundle is produced for the user-selected fiducial spectra and spectral range. The fiducial spectra are selected in the «Fiducial spectra calculator» window. The spectral range is selected by dragging the vertical lines in the «Fiducial spectra calculator» window.
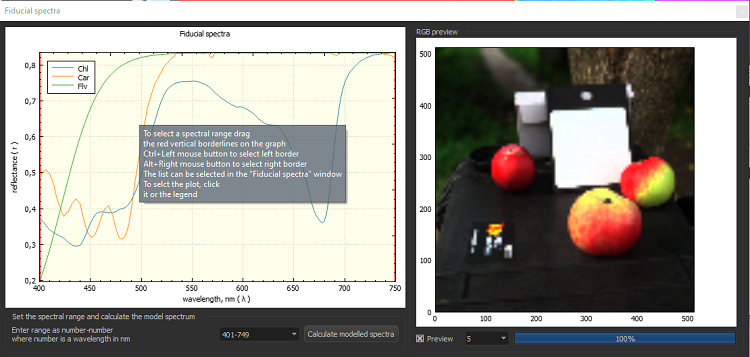
For express selecting the left or right limits of the spectral range, use <Ctrl> + left click or <Alt > + left click.
Click on the legend in the top part of the «Fiducial spectra calculator» filed selects and highlights a fiducial spectrum.
The previously selected spectral ranges can be reused by selecting them from the drop-down list in the middle-bottom part of the window. Checking «Preview» checkbox enables calculation of the preview for the results of the fitting. The preview quality is selected in the dropdown at the bottom, it ranges from 2 (most precise, slowest) to 10 (most coarse, fastest). After preview calculation, the list of calculated histograms appears in the top right part of the window. These histograms allow to estimate the quality of the results for specific combination of the fiducial spectra in the particular spectral range. Click on the histogram opens the corresponding index image from the fitting bundle. The “Preview” window can be moved with mouse or zoomed with mouse wheel. After calculating a preview, a shortcut for image selection from the bundle becomes active.
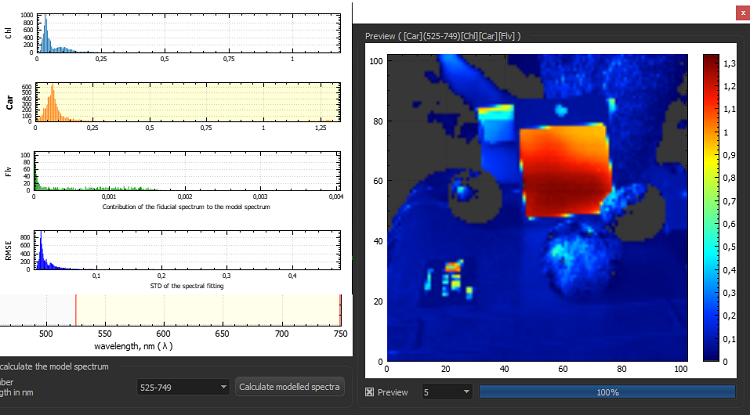
After obtaining a preview of satisfactory quality, you can do the complete calculations by clicking the «Fit» button. When the calculation completes, the resulting fitting bundle will appear in the «Fitting bundles» window and the main image will switch to the RGB mode. Items in the «Fitting bundles» window are directly selectable with the mouse.
The shortcut menu items for the «Fiducial spectra» window:
- Save fiducial spectra image… saves image of the spectral curve plot to PNG, JPG, or PDF file written by default to the Working folder.
- Save fiducial spectra to CSV… saves the numerical representation of the fiducial spectra to Excel *.csv file written by default to the Working folder.
The window «Spectral analysis” is designed for displaying of the spectra corresponding to the ROIs selected in the «ROIs» window.
The spectra are shown in the upper part of the window along with their legend. Click on a legend item selects the corresponding spectrum.
Different spectral bands in the visible part of the spectrum are highlighted with colors (if highlight is enabled through the options).
This window is updated on selecting a different ROI in the «ROIs» window or after relocating the selected ROI to different part of the Image in the main window.
The spectra on the plot are scaled and panned with the mouse and/or mouse wheel. Hovering mouse over the spectra opens a tooltip with the name of the spectrum, current wavelength, and the amplitude. Clicking on a spectrum (i) highlights the whole spectrum with bold line and color, (ii) sets the crosswire marker in this point of the spectrum, (iii) drops the values of this point of the spectrum to the corresponding fields of this window:
- the actual wavelength and the amplitude on the left;
- the corrected wavelength for the constructing of spectral indexes on the left;
The crosswire marker can be moved left or right with left or right arrow keys.

Shortcut menu items of the spectra plot:
- Save spectra to image… saves the image of the spectral curves as PDF, PNG, or JPG files located by default in the Working folder.
- Save spectra to Excel *.csv… saves the spectra in numeric form as Excel CSV file located by default in the Working folder.
- Save ROI to file… saves ROI to a *.roi file located by default in the Working folder.
At the bottom of the Spectral analysis window, two mode switches are located (at the left):
- Spectral range highlight;
- Show dispersion (shows the dispersion of the spectra within the ROI around their average values);
At the right, the «Fit to window» button is located (displays whole spectra by fitting them into the window) together with the field for composing of spectral indexes (holding the sample index formula). To compose a spectral index, click the desired points of spectra on the graph and complete the formula with the arithmetic operators (« + », « - », « / », « * »). The resulting formula can be copied to the corresponding field of the Calculate index by the formula window.
You can also directly enter the index formula and name in this window (use the tooltips as a guidance) and click «Compute index image». The newly computed index image shall be appended to the index image list in the «Images» window and the false-colored computed image will be overlayed on the current Image in the main window.
The Channels window is used for displaying, managing, loading, and saving the user-defined lists of spectral channels lists. The window header contains the information on the number and width of spectral channels in the form of “Channel list - [204:397-1004::3.0]” meaning that the dataset (the hypercube) consists of 204 spectral channels in the spectral range 397 nm – 1004 nm, the channels are 3 nm wide. If the channel width varies, an average channel width is presented calculated as a difference of spectral range borders divided by the total number of spectral channels.
This window contains the list of spectral channels, for each spectral channel it displays the number of the channel and its corresponding wavelength in nm. The channels in the visible range these channels are color coded, the channels outside the visible range are not. You can select channels for further processing by checking the checkboxes of the desired channels.
At the bottom of the window, a slider for interactive browsing of spectral channels is located. By dragging this slider, you change the current spectral channel; the change of the current spectral channel is also reflected in the image in the main window of the program.

Shortcut menu items for this window:
- Show all channels shows all channels, including previously hidden ones.
- Select all channels checks the selection checkboxes for all channels.
- Deselect all channels deselects all spectral channels.
- Load and show a channel list… loads and displays a channel list from a *.splst file searched by default in the current folder.
- Save selected channel list… saves the selected channel list to a *.splst file located by default in the current folder.
- Show selected channels only displays the list containing only the selected (checked) channels.
- Display each 2nd channel displays each second channel e.g. channels 1,3,5,…
- Display each 5th channel displays each fifth channel e.g. channels 1,6,11…
- Display each 10th channel displays each tenth channel e.g. channels 1,11,21…
- Save selected channels to a file … saves selected channels to files of different format (see the description of the “Saving selected channels to file» window below.