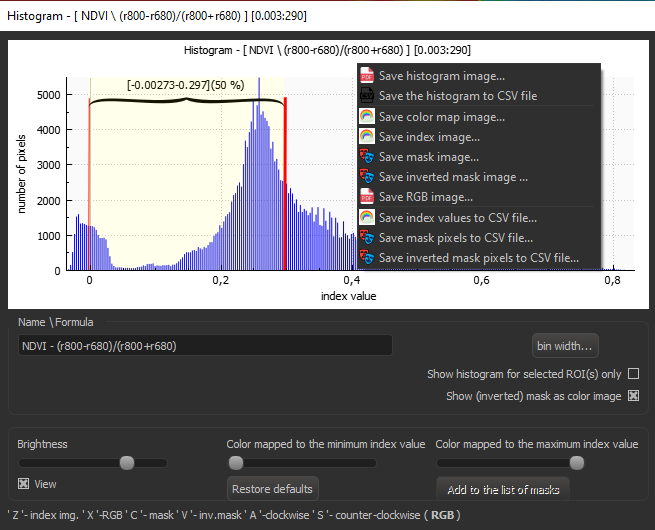
The «Histogram» window is used for displaying of the histogram for the entire image of the ROI(s) selected in the «Images» window.
In the header of the window, the following information is displayed, for example: «Histogram - [Difference 833/658 r833-r658][0.004:317]», where «Difference 833/658» - is a sample index name, «r833-r658» - the sample index formula, «0.004:317» - the class interval and the total number of the classes in the histogram.
In the upper left part of the window, the histogram is displayed with a duplicate header line and vertical lines showing max/min thresholds. These thresholds define the index value range displayed as the index images in the center (area#1, the color map) or at the right (area#2) of the Histogram window.
On hovering over the vertical threshold lines, the mouse pointer changes so you can drag the threshold lines to adjust the clipping limits. These changes are reflected in the numeric labels located above e.g. [-0.107-0.166](24%), where «-0.107-0.166» are the lower and upper limits, and «24%» is the proportion of the total datapoints represented on the histogram within the current limits.
In the left, there is the «Name Formula» set of controls including:
- mask name field (used for saving the mask);
- the checkbox «Show histogram only for selected ROI(s)»—toggles the histogram calculation mode;
- the checkbox «Show color mask/inverted mask»—toggles color vs. black and white mask image modes;
- the «Interval…» button—sets width of the class interval and total number of the classes for the histogram. To check the adjustments, click «Apply», to finish click «ОК»;
- the slider «Brightness» controls brightness of the image shown in the area#2;
- the slider «Min. index color mapping» controls color bar of the image shown in the area#2;
- the slider «Max. index color mapping» controls color bar of the image shown in the area#2;
- the button «Reset» brigs back the default min/max values of the index and shows all datapoints (100%) on the histogram;
- the button «Add to mask list» saves the current mask image (or inverted mask image, if enabled for the area#2 by the option «Mask»/«Inv. mask»);
- Hints on the hotkeys for the area#2 (the keys «Z», «X», «C», «V», «A», «S»);

The shortcut menu items for the histogram:
- Save histogram image… saves the image of the histogram as PNG, JPG, or BMP file written by default to the Working folder.
- Save histogram as Excel *.csv… saves a numeric representation of the histogram to an Excel *.csv file by default written to the Working folder.
- Save colormap image… saves the false-colored image from the area#1 of the Histogram window as PNG, JPG, or BMP file written by default to the Working folder.
- Save index image… saves the index image from the area#2 of the Histogram window to PDF, PNG, JPG, or BMP file written by default to the Working folder.
- Save mask image… saves the mask image from the area#2 of the Histogram window to PNG, JPG, BMP file written by default to the Working folder.
- Save inv. mask image… saves the inverted mask image from the area#2 of the Histogram window to PNG, JPG, or BMP file written by default to the Working folder.
- Save RGB image… saves the natural-colored image from the area#2 of the Histogram window to PNG, JPG, or BMP file written by default to the Working folder.
- Save index to Excel *.csv… saves the numeric representation of the index image to Excel *.csv file written by default to the Working folder.
- Save mask to Excel *.csv… saves the numeric representation of the mask image to Excel *.csv file written by default to the Working folder.
- Save inv. mask to Excel *.csv… saves the numeric representation of the inverted mask image to Excel *.csv file written by default to the Working folder.
