About
Gelion supports supported: ENVI *.hdr,
*.jpg, *.png, *.tif. for input, *
.jpg, *.png, *.pdf, EXCEL *.csv for output. Feature overview: user-oriented
interface supporting zoom/rotate; editable point, line, shape, and polyline ROI;
extraction/display of spectra; preset and customizable index calculation; histograms
for ROIs or the entire image; heatmaps with selectable color coding; masking based
on index image thresholding; ROI-to-mask and mask-to-ROI conversion; mask-based calculations.
Please mind tooltips and modifier keys (Alt & Ctrl) for more features which are
designed to be «always at hand».
System requirements and installing the software
64-bit Windows 10 or newer
64-bit Ubuntu 20.04 LTS
8GB or more RAM, disk space sufficient for storage your output and intermittent data
A mouse with a wheel.
To install,
Windows, run setup program Gelion-windows-x64-1.0-beta-en.exe.
Ubuntu, just unzip the archive file Gelion-Ubuntu-20-04-LTS-x64-1.0-beta-en.tar.gz to any folder, change files access
<GelionFolder> $ chmod +x ‘./Gelion 1.0b.sh’
<GelionFolder> $ chmod +x /bin/January09
and run script <GelionFolder> $ ‘./Gelion 1.0b.sh’.
If you are new to Gelion, you might want to familiarize yourself with the software using
the supplied sample datasets (downloaded separately).
Abbreviations and Hotkeys
Abbreviations used in this help:
LMC - left mouse click;
RM - right mouse click;
MW - mouse wheel;
ROI - region of interest, see the section «ROIs» Menu;
main window - Main window;
mask image - mask-based image;
Hotkeys
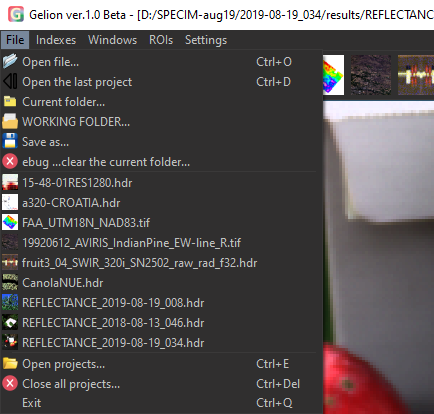
<Ctrl-O> in the Main window - open project file;
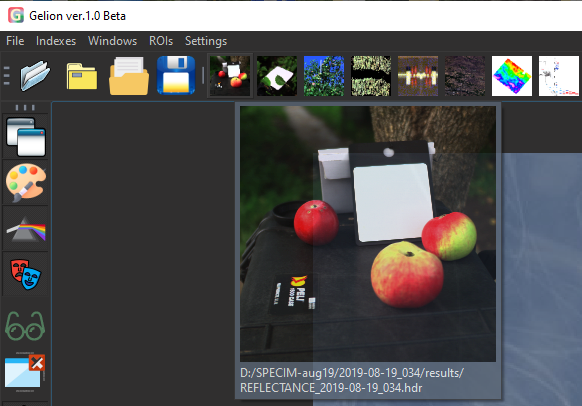
<Ctrl-D> in the Main window - open last project;
<Ctrl-E> in the Main window - bring up the open projects list;
<Ctrl-Del> in the Main window - close all open projects (with confirmation);
<Ctrl-Q> in the Main window - exit;
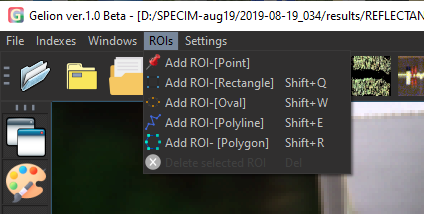
<Ctrl-LMC> in the Main window - add [Point] ROI;
<Shift-Q> in the Main window - add [Rectangle] ROI;
<Shift-W> in the Main window - add [Oval] ROI;
<Shift-E> in the Main window - add [Polyline] ROI;
<Shift-R> in the Main window - add [Polygon] ROI;
<Alt-LMC> in the Main window - adding another ROI of the last selected type (indicated in the “Repeat” area of the status bar;
<Alt-W> toggle «Histogram» window ;
<Alt-D> toggle «Mask image calculator» window ;
<Alt-S> toggle «Spectral analysis» window ;
<Alt-F> toggle «Fiducial spectra» window ;
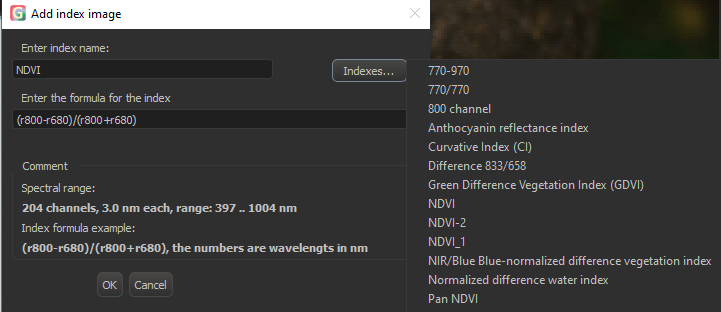
<Alt-I> add an index image in the Calculate index by the formula window;
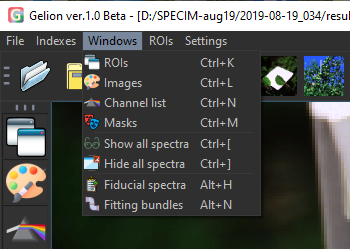
<Ctrl-K> in Main window - toggle «ROIs» window ;
<Ctrl-L> in Main window - toggle «Images» window ;
<Ctrl-M> in Main window - toggle «Channel list» window ;
<Ctrl-N> in Main window - toggle «Masks» window ;
<Ctrl-[> in Main window - show all spectra;
<Ctrl-]> in Main window - hide all spectra;
<Alt-H> in Main window - toggle «Fiducial spectra» window ;
<Alt-N> in Main window - toggle «Fitting bundles» window ;
<Shift-S> - settings «Settings» menu ;
<F1> - Help;
<A> in Main window - rotate main window content counterclockwise;
<S> in Main window - rotate main window content clockwise;
Supported formats
Import
Most common input format is ENVI, the BIL, BIP or BSQ data order and
integer uint8, int16, uint16 as well as single or double data types.
It is also possible to open JPG, PNG, Tiff (geoTIF) files—they are converted (JPG, PNG) to ENVI automatically.
This software was tested on the dataset obtained with a Specim IQ hyperspectral camera, the testing dataset
is available for download at the program website gelion.agro.msu.ru.
We did not test the datasets coming from different spectrometers, but they are supported given that they can write
standard ENVI files. If you will encounter problems due to a non-standard data format,
please let us know by dropping an e-mail to gelion-team@yandex.com so we shall do our best
to fix this problem.
Export
The following formats are supported for export:
-images: PDF, PNG, JPG;
-text data: Excel *.csv;
Program overview
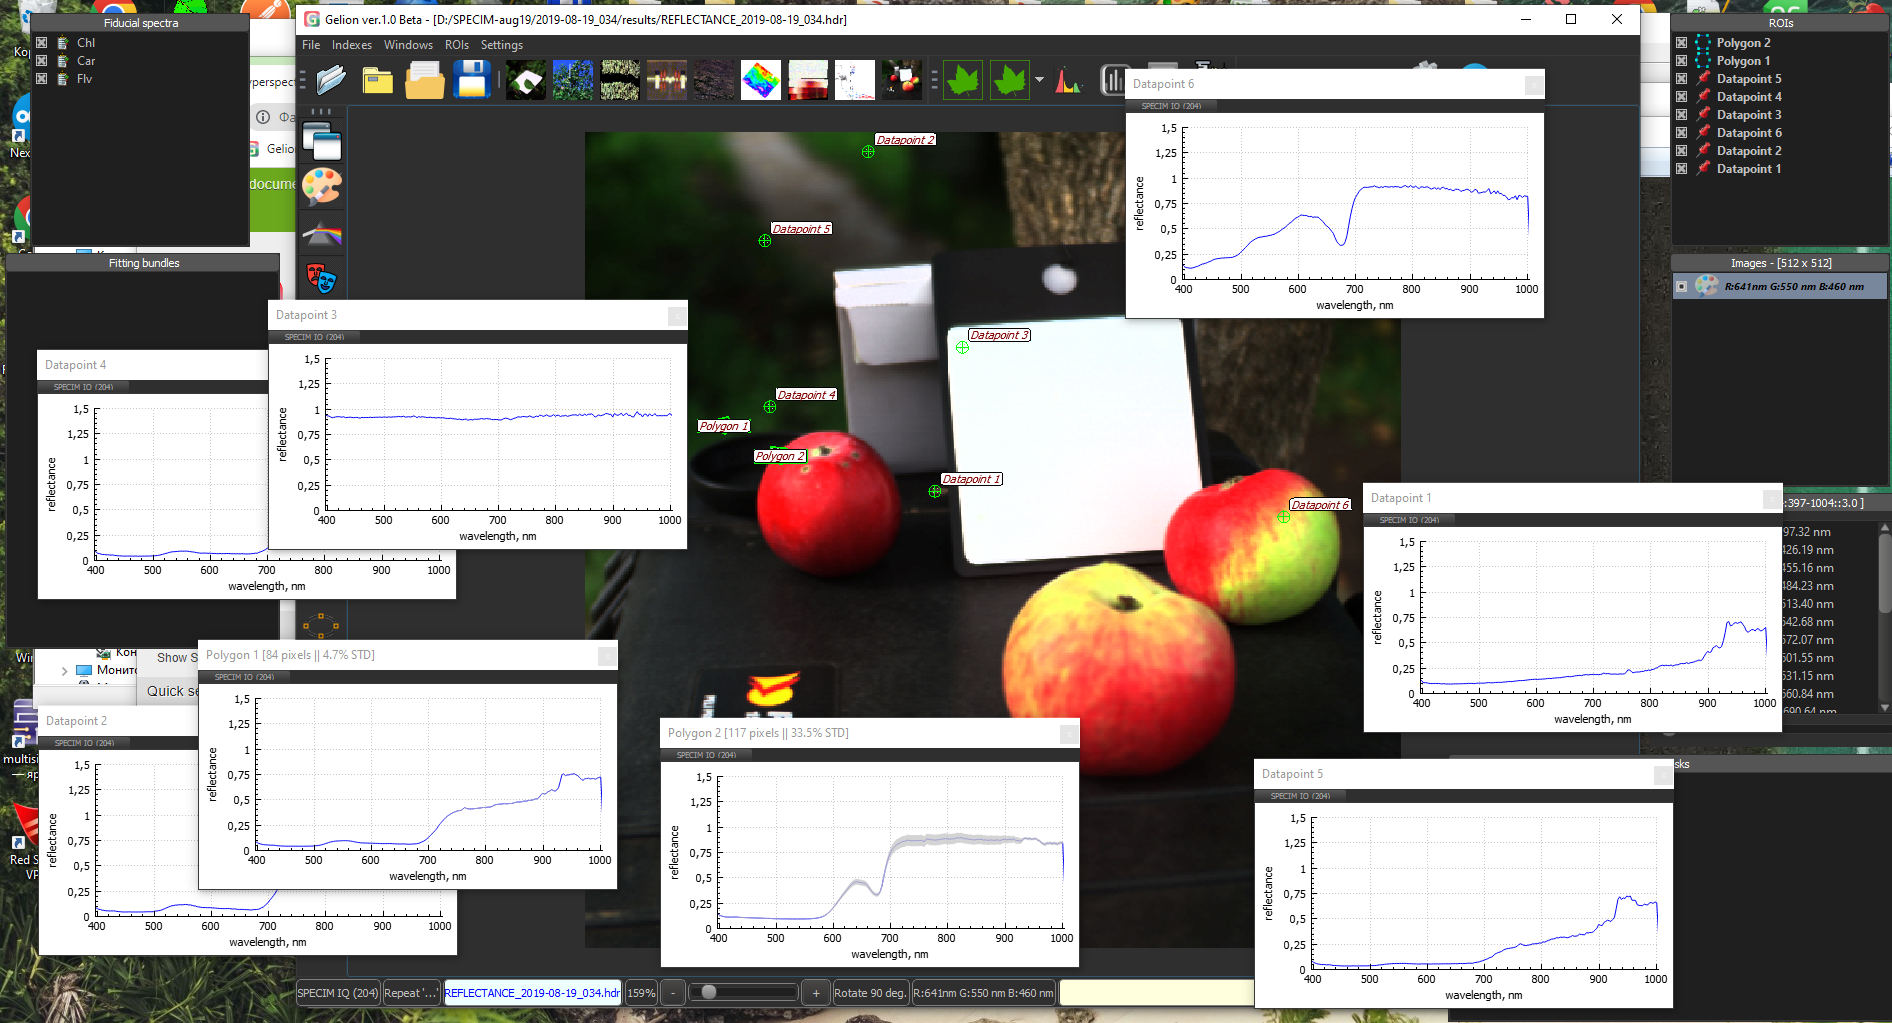
After you launch the program, the Main window opens in center of your desktop,
the auxiliary windows «ROIs» window, «Images» window, «Channel list» window are shown at the right,
as well as «Masks» window, the auxiliary windows «Fiducial spectra» window and «Fitting bundles» window
are shown at the left. The auxiliary windows are used to select images and perform a different processing
procedures within current project.
You can open as many projects as you want, switch between the open projects and
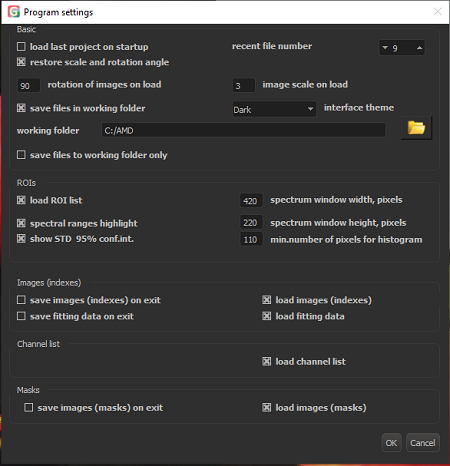
close all open projects. Depending on settings (see «Settings» menu, you can save
the current status of the project so it can be restored automatically when you open this project next time.
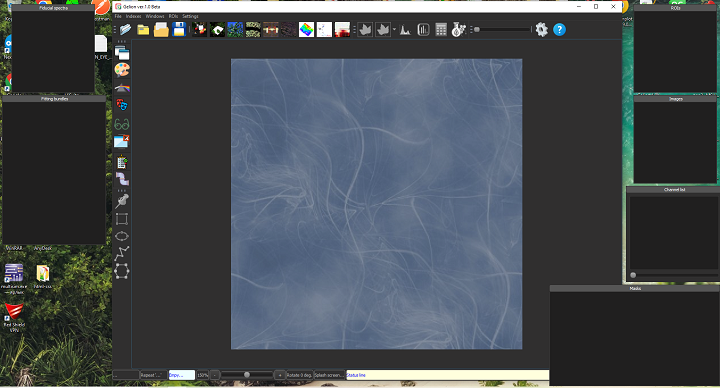
You can place the auxiliary windows where you want,
show or hide them of dock them to the Main window (see below).
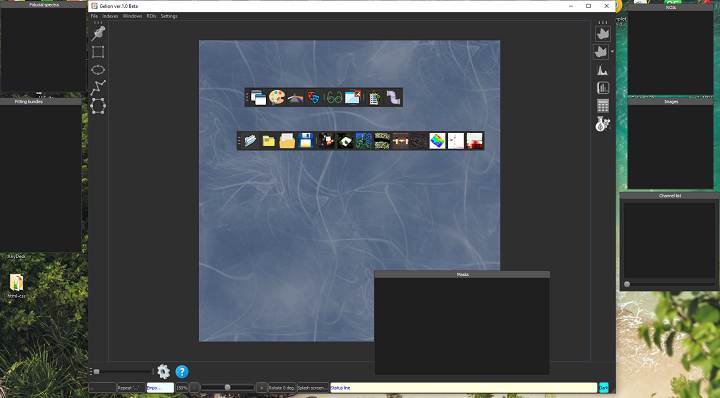
Main window
Main window opens in the center of the desktop when you start Gelion with main menu
and the toolbar with the buttons.
The toolbars offer access to the same features as contained in main menu, you can drag
then at any place on the screen and dock them to any side of the main window. You can also
dock the auxiliary windows «ROIs» window, «Images» window, «Channel list» window,
«Masks» window, «Fiducial spectra» window, «Fitting bundles» window.
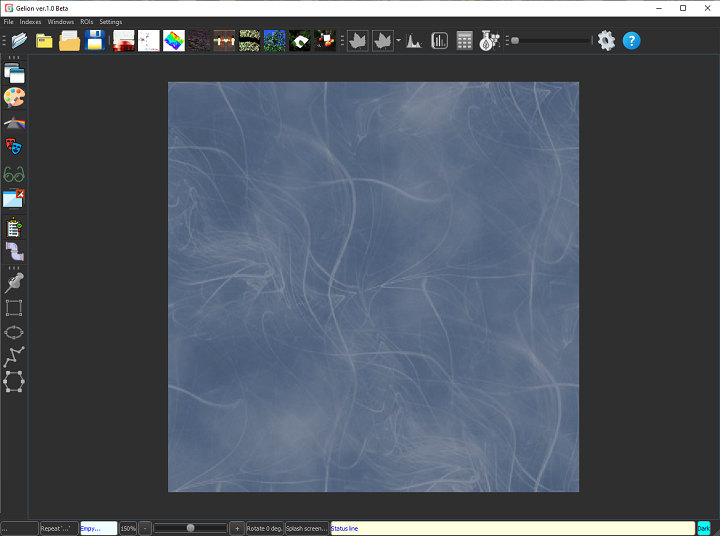
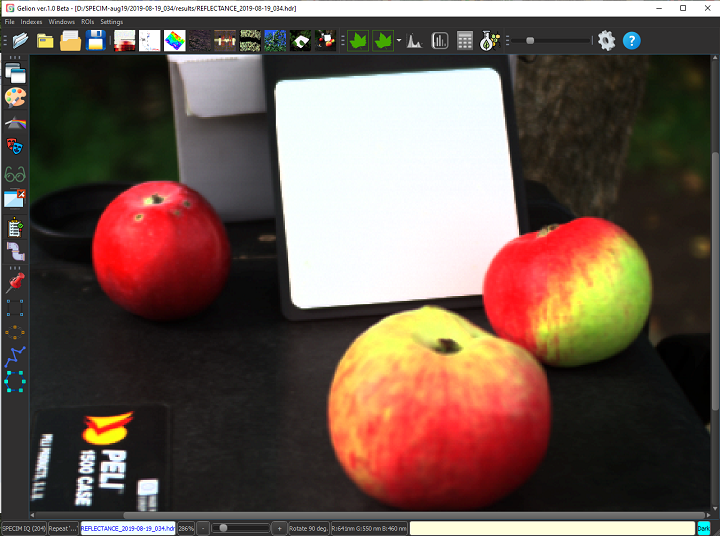
Image in the main window
The main image is located inside the main window, it can be resized and rotated, you can also change its displayed brightness.
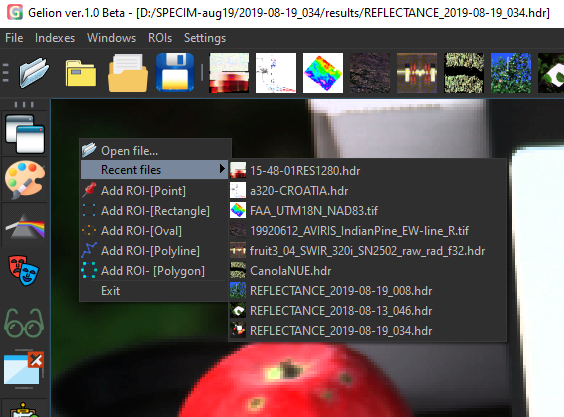
The shortcut menu of the main image window provides the selection of the ROI type to enter, the list of recently
opened projects and the exit command.
Resize, drag and rotate
The main image is resized by Ctrl + mouse wheel.
The main image is rotated by Shift + mouse wheel.
To scroll/pan the main imaged if it does not fit the main window, drag the image
with the mouse. If the left mouse click before dragging was on a ROI, this ROI will be dragged.
ROI
ROI is a geometrical object drawn in the Main window , encompassing a certain number of pixels and characterized by unique average spectral profile,
spectral brightness distribution/histogram, deviation of these values etc.
The following ROI types are supported:
- point;
- rectangle;
- oval;
- polyline;
- polygon;
You can: - Adding ROI , Changing ROI or Deleting ROI .
Adding ROI
The following ROI types are supported:
- point;
- rectangle;
- oval;
- polyline;
- polygon;
A Point ROI is added by <Ctrl + left mouse click> in the main image or using the item «Add ROI ROI-[Point]» of the main image shortcut menu.
A Rectangle ROI is added using the «Add ROI-[Rectangle]» item of the main image shortcut menu.
To set the ROI size on its main axis, drag the mouse. Thu set the ROI with,
use the mouse wheel. To finish the entry of the ROI, left click.
An Oval ROI is added using the «Add ROI-[Oval]» item of the main image shortcut menu.
To set the ROI size on its main axis, drag the mouse. Thu set the ROI with,
use the mouse wheel. To finish the entry of the ROI, left click.
A Polyline ROI is added using the «Add ROI-[Polyline]» item of the main image shortcut menu.
To set the ROI size on its main axis, drag the mouse. Thu set the ROI with,
use the mouse wheel. To finish the entry of the ROI, left click.
ROI Polygon ROI is added using the «Add ROI-[Polygon]» item of the main image shortcut menu.
To set the ROI size on its main axis, drag the mouse. Thu set the ROI with,
use the mouse wheel. To finish the entry of the ROI, left click.
To add multiple instances of Rectangle, Oval, Polyline or Polygon ROIs one can
use <Alt + left mouse click> and then set the ROI size and/or the apexes depending on the ROI type.
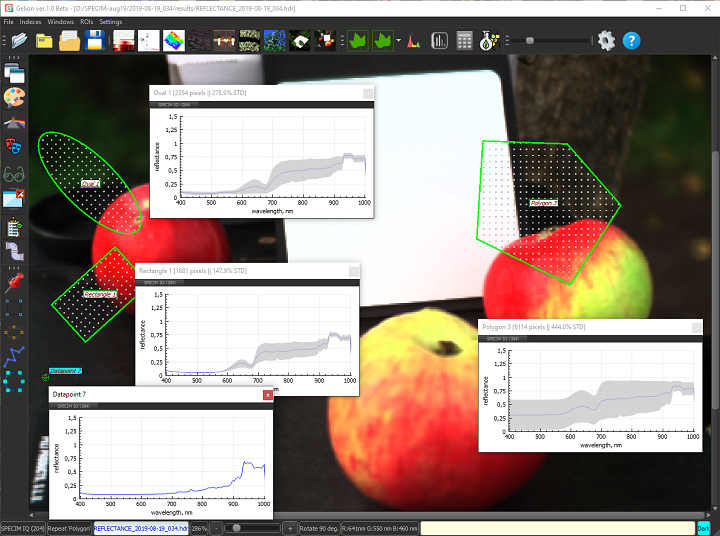
After adding a ROI, the window appears containing the average spectrum of the pixels encompassed by the ROI. Each ROI has a single window of that type associated with this ROI.
You can resize, drag/pan this window, and toggle its visibility.
In addition to the shortcut menu commands, you can use the «ROIs» Menu item of the main menu
or the ROI toolbar in the left upper corner of the main window of the program.
Changing ROI
ROI have two visually discernible states.
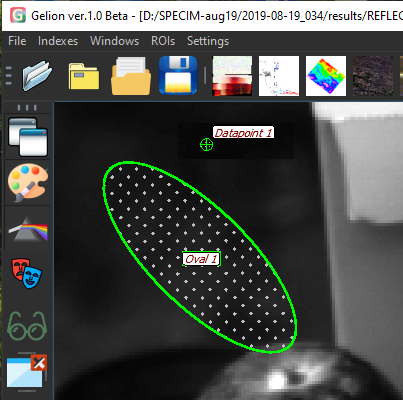
ROI is inactive (non-selected)
The name of the ROI is displayed on a white background, no selection markers visible. To de-activate the ROI, left mouse click outside the ROI.
ROI is active
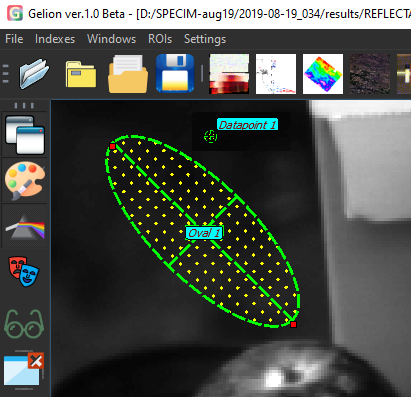
The name of the ROI is displayed on the blue background, for shape-type ROI — selection markers used for changing the ROI are visible.
Double-click on ROI opens a dialog for setting up the ROI (note the relevant tool tips) or deleting the ROI.
You can reposition ROI by dragging it with mouse.
Deleting ROI
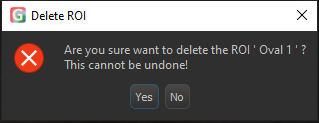
To remove ROI, select if to make the ROI is active.
Then you can press Del or double-click the ROI or its item in the «ROIs» window
check the «Delete ROI» checkbox and click «Ок».
Adjusting the displayed brightness
To adjust the displayed brightness of the main image, drag the slider on the toolbar at the top of the
Main window. The slider is labelled by the tooltip «Brigtness».
Status bar

The status bar is located at the bottom of the Main window.
It displays the following information about the current project:
- spectrometer name - the name of the device used to capture the image mentioned in the «ENVI description» field of the *.hdr file of the project. The number of spectral channels is indicated in brackets.
- multiple ROI entry—see above in Adding ROI section.
- current project name—brief name of current project.
- scale, %, see Resize, drag and rotate.
- «-», «+», and the slider—zooming the main image, see Resize, drag and rotate.
- rotation angle, deg. - the angle of the image rotation.
- main image content (channel, index, mask, etc.) - information of the current content of the image in the main window.
- info line (optional)—important notifications.
- interface theme—see the «Settings» menu, Linux, MacOS, Aqua and Dark themes available.
Auxiliary windows
«Spectrum» window
“Spectrum» window displays current spectrum. To scale of X and Y axes, left click + mouse wheel. The window displays the current ROI name, number of its pixels, average spectrum, and its STD (not valid for the point-type ROIs).
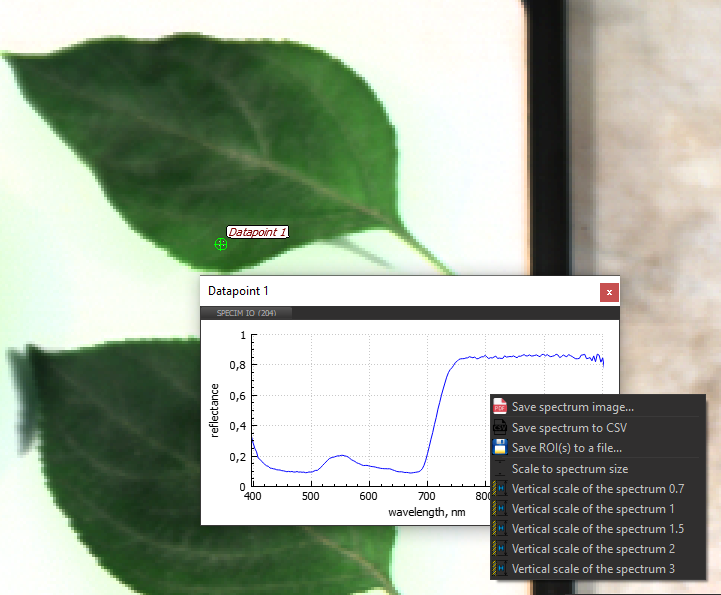
Shortcut menu items:
- Save as image… saves the image of the spectrum as PDF, PNG, or JPG.
- Save to Excel *.csv… saves the editable spectrum as Excel CSV.
- Save ROI as *.roi… saves ROI for this spectrum to a ROI. file. The ROI files are special format for storing ROI-related information so the ROI can be restored later.
- Fit to window scales the spectrum to fit it into the Spectrum window size.
- Vertical scale 0.7 sets the vertical scale to 0.7.
- Vertical scale 1 sets the vertical scale to 1.
- Vertical scale 1.5 sets the vertical scale to 1.5.
- Vertical scale 2 sets the vertical scale to 2.
- Vertical scale 3 sets the vertical scale to 3.
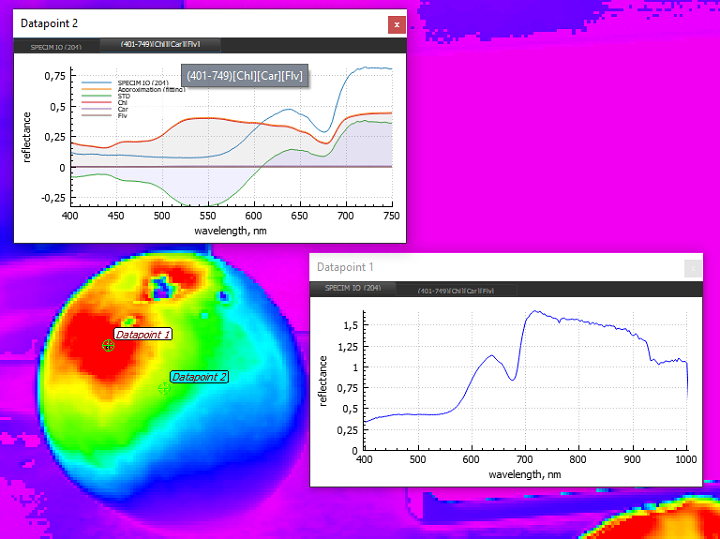
The window at the top has a menu bar that allows you to switch to viewing modes like a spectrum,
received by the device, for example, “Specim IQ”, the spectrum of which is always displayed in the left menu item,
and the fitting profiles contributions of various standards obtained during the execution of racsets in «Fiducial spectra calculator» window.
When choosing the mode of displaying the results of calculation of fitting packages, the window has a context menu:
- Save spectrum image… saves the image of the spectrum and fitting profiles as PDF, PNG, JPG.
- Scale to spectrum size sets the vertical scale to the spectrum.
- Scale to fitting results sets the vertical scale to fitting profiles.
- Save the ROI with fitting results to PDF or CSV customizable ability to batch save a list of ROIs in graphic and text formats.
Important:
When moving the ROI «point» type in the window, the spectrum are changed, scaled to fitting profiles,
but if the “Shift” key is pressed while moving, then the scaling will be carried out according to the spectrum.
Switching in all ROI windows to the mode «spectrum» available in the context menu «Fitting bundles» window.
«ROIs» window
ROIs window is used to manage, save or load the user-created ROIs. The following ROI types are supported:
- point;
- rectangle;
- oval;
- polyline;
- polygon;
ROI are set and edited as described in the section Changing ROI.
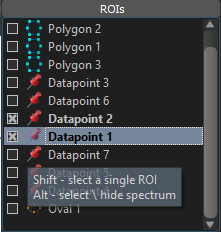
A sample ROI window (supports tooltips) is shown below. When selecting a ROI with Shift pressed (the ROI is marked by checkbox) the single ROI will be selected and all other ROIs will be deselected.
When selecting a ROI with Alt pressed, this ROI will be selected but the Spectrum window will not appear (otherwise it appears for every newly added ROI).
Clicking the ROI toggles the ROI selection (Selected ROI’s name is bold and its Spectrum window is displayed; deselected/inactive ROI’s name is not bold and its Spectrum window is hidden).
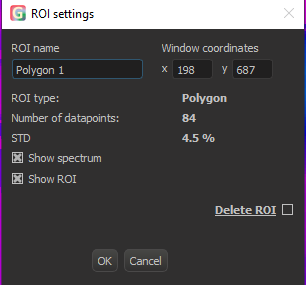
Double click of a ROI name shows the modal name «ROI setup».
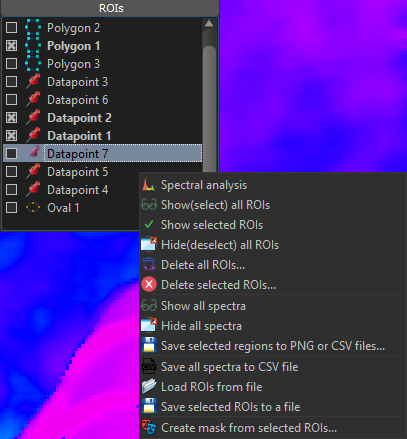
Shortcut menu items for this window:
- Spectral analysis shows «Spectral analysis» window.
- Show all ROIs shows all ROIs.
- Show selected ROIs shows all ROIs marked by checkbox in the ROI list.
- Hide all ROIs hides all ROIs.
- Delete all ROIs deletes all ROIs with confirmation and a warning about the loss of all unsaved ROIs.
- Delete selected ROIs deletes selected ROIs with confirmation and a warning about the loss of all unsaved ROIs.
- Show all spectra the same as main menu “Window->Show all spectra”.
- Hide all spectra the same as main menu “Window->Hide all spectra”.
- Save selected ROIs to *.pdf and *.csv files… saves selected ROIs to images and CSV files. Each ROI is saved to a separate file named after this ROI name.
- Save all spectra to Excel *.csv file… writes spectra from the selected ROIs to a single Excel *.csv file.
- Load ROI(s) from a *.roi file… restores ROI(s) from a *.roi file.
- Save selected ROI(s) to a *.roi file… saves the ROI(s) selected by checkboxes in the ROI list to a *.roi file.
- Mask from ROI… creates mask(s) from selected ROI(s) via the «Mask from ROI» window.
«Save selected ROIs to PDF and CSV” window.
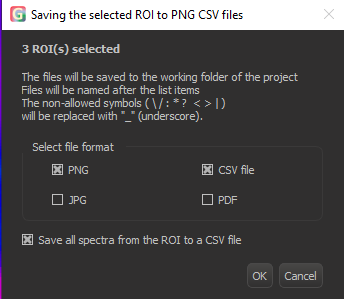
Each selected ROI is saved to its own file. The saving format is set in the «Select format” area. Thus, if five ROIs are selected and formats «PNG» and «CSV» are checked, 10 files (i.e. 5 PNG and 5 CSV files) will be generated.|br|
IMPORTANT: If the option «Save all spectra to csv…» is checked, individual spectra will be written to the CSV file, otherwise only the average spectra will be saved.
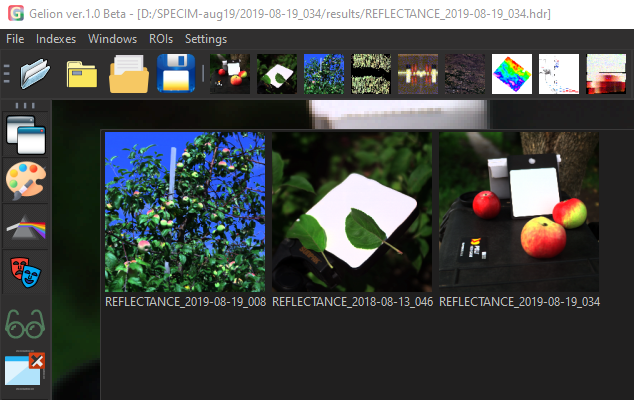
«Images» window
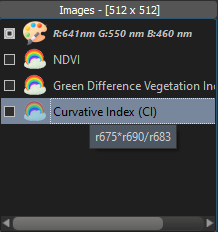
The Images window is used to manage, display, hide and sabe RGB-images and index-based images.
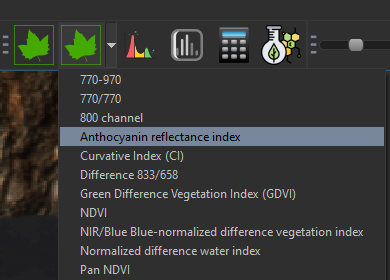
This window contains the list of index images. Click on an item of this list opens the RGB-image or the selected index image in the main window. For the index image selected in this way, the «Histogram» window and all its features is activated. Hovering mouse over the index image name displays the tooltip with the formula of the corresponding index. Select the items in this list to further process them. The window header contains the information on the image pixel dimensions in the form «Image - [512 х 428]”, where 512 is the image width and 428 is the image height.
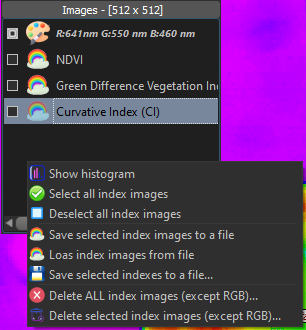
Shortcut menu items for this window:
- Show histogram opens the «Histogram» window.
- Select all index images checks the selection boxes for all index images in the list (except the RGB image).
- Deselect all index images deselects all index images in the list (except the RGB image).
- Save selected index images to *.index file … saves selected (checked in the list) index images (except the RGB image) to a binary *.index-file.
- Load index images from *.index file… restore index images (except the RGB image) from the binary *.index file. The loaded images are appended to index image list in the Images window from the bottom.
- Save selected index images… saves the selected index images to file(s), see the description of the «Saving selected indexes» window below.
- Delete ALL index images (except RGB) … deletes all index images (except the RGB image) with confirmation and a warning about the loss of all unsaved work.
- Delete selected index images (except RGB) … deletes the index images selected (checked in the index image list, except the RGB image) with confirmation and a warning about the loss of all unsaved work.
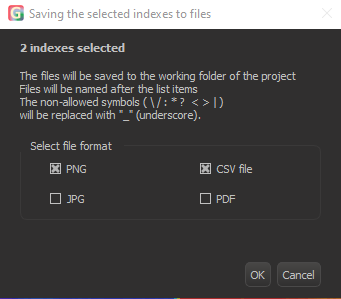
Each selected index image (except the RGB image) is saved into individual file(s) of the format selected in the “Select file format” area. Thus, if two index images are selected and «PNG» with «Excel CSV» are checked, four files will be generated (two PNG and two CSV files). The files will be written to the Working folder.
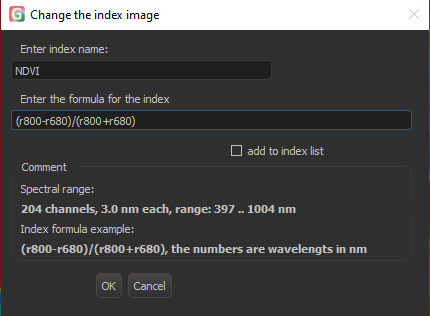
Double click of an item of the list allows to edit the formula of the index via the window «Edit index image». If the option «Add to the index list» is checked, the edited index will be appended to the index list, otherwise the source index will be replaced with the newly edited one.
«Channel list» window
The Channels window is used for displaying, managing, loading, and saving the user-defined lists of spectral channels lists. The window header contains the information on the number and width of spectral channels in the form of “Channel list - [204:397-1004::3.0]” meaning that the dataset (the hypercube) consists of 204 spectral channels in the spectral range 397 nm – 1004 nm, the channels are 3 nm wide. If the channel width varies, an average channel width is presented calculated as a difference of spectral range borders divided by the total number of spectral channels.
This window contains the list of spectral channels, for each spectral channel it displays the number of the channel and its corresponding wavelength in nm. The channels in the visible range these channels are color coded, the channels outside the visible range are not. You can select channels for further processing by checking the checkboxes of the desired channels.
At the bottom of the window, a slider for interactive browsing of spectral channels is located. By dragging this slider, you change the current spectral channel; the change of the current spectral channel is also reflected in the image in the main window of the program.
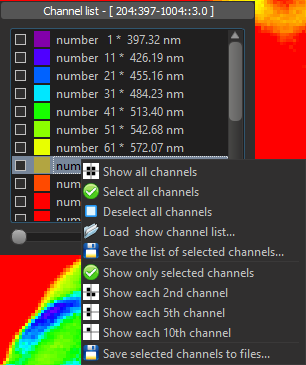
Shortcut menu items for this window:
- Show all channels shows all channels, including previously hidden ones.
- Select all channels checks the selection checkboxes for all channels.
- Deselect all channels deselects all spectral channels.
- Load and show a channel list… loads and displays a channel list from a *.splst file searched by default in the current folder.
- Save selected channel list… saves the selected channel list to a *.splst file located by default in the current folder.
- Show selected channels only displays the list containing only the selected (checked) channels.
- Display each 2nd channel displays each second channel e.g. channels 1,3,5,…
- Display each 5th channel displays each fifth channel e.g. channels 1,6,11…
- Display each 10th channel displays each tenth channel e.g. channels 1,11,21…
- Save selected channels to a file … saves selected channels to files of different format (see the description of the “Saving selected channels to file» window below.
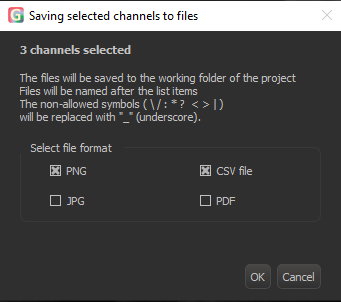
Each selected spectral channel is saved to an individual file of the format(s) selected in the area «Select file format». Thus, if four channels are selected and the “PNG » and “Excel CSV “ formats are chosen, eight files in total (4 PNG and 4 CSV files) will be generated in the Working folder.
«Masks» window
The Masks window is used for displaying, managing, loading, and saving mask images. To add mask image, click the button «Add to mask list» in the «Histogram» window or load a mask from a file via the shortcut menu «Load mask image from file (*.mask) …».
This window displays thumbnails of the mask images along with the names of the masks. The mask images in this window can be selected (by checking the corresponding checkbox) for further processing.
Mask images can be loaded to the «Mask image calculator» window by dragging with mouse or via the shortcut menu of this window.
On click of a mask image thumbnail, the main image is replaced by this mask. Ctrl + click of a mask image thumbnail causes the mask to be applied to the main image regardless of its type (index image, spectral channel, or a fitting bundle). To undo the masking, Alt + click the corresponding mask image.
This window supports tooltips as well.
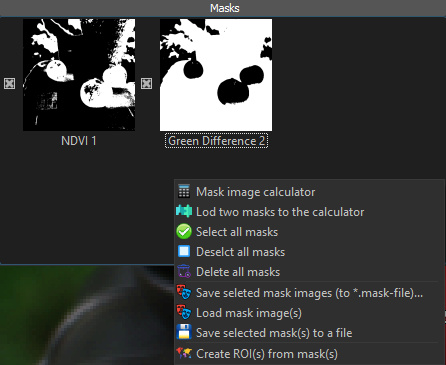
Shortcut menu items for this window:
- Mask image calculator opens the «Mask image calculator» window.
- Load 2 selected masks into the calculator if two masks are selected (their checkboxes are checked), these masks will be loaded to the «Mask image calculator» window for further processing.
- Select all masks selects (checks) all mask images.
- Deselect all masks deselects (unchecks) all mask images.
- Remove all masks removes all mask images from the list after the confirmation.
- Save selected masks (*.mask)… saves selected mask images to a binary *.mask
file. By default, this file is written to the Working folder.
- Load mask images (*.mask) … loads mask images from a binary *.mask file and appends them to the list. By default, this file is looked up in the Working folder.
- Save selected masks to files… saves the selected mask images to image files, see the description of the “Saving masks to files» window below.
- ROI from mask… creates a ROI from the mask via the ` «ROI from mask» window`_.
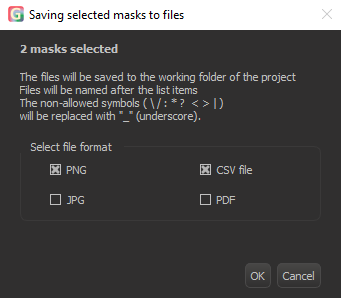
Each selected (checked) mask image is saved to an individual file of the format selected in the area «Select file format». Thus, if three masks are selected and the formats «PNG», «Excel CSV», «JPG”, and «PDF» are chosen, 12 files (3 PNG, 3 CSV, 3 JPG, and 3 PDF files) will be generated in the Working folder.
«Fiducial spectra» window
The Fiducial spectra window is used for displaying the list of available fiducial spectra. The display mode is set with the «Window», «Fiducial spectra» main menu item or by the corresponding button on the toolbar.
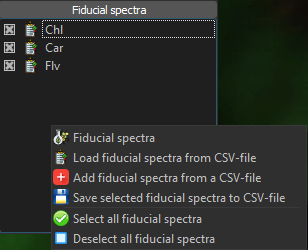
The context menu items for this window:
- Fiducial spectra» opens the «Fiducial spectra» window.
- Load fiducial spectra from (*.csv)… loads a set of fiducial spectra from a file.
- Add fiducial spectra from file (*.csv)… appends a set of fiducial spectra from a file.
- Save selected fiducial spectra to file (*.csv)… saves the selected fiducial spectra to file.
- Select all fiducial spectra selects all the fiducial spectra.
- Deselect all fiducial spectra deselects and removes all the fiducial spectra from the «Fiducial spectra» window.
Checking/unchecking the checkboxes alters the selected fiducial spectra list. These changes are reflected by the list in the «Fiducial spectra» window which displays elected spectra only.
The fiducial spectra *.csv file should be structured as follows:
wl;Chl;Car;Flv
750;0,834350052;0,823485629;0,834303625
748;0,835547974;0,821994209;0,834303623
746;0,83377621;0,825567947;0,83430362
744;0,833184413;0,827142669;0,834303617
742;0,83199606;0,829764693;0,834303613
740;0,831405457;0,827865918;0,834303609
…
where wl;Chl;Car;Flv – are the fields (columns) representing wavelength and the spectra of the absorbing compounds of interest; the fields are separated by semicolon «;»
. The file is comprised by arbitrary number of lines formed by these fields any line always starts from the wavelength field followed by the reflectance value constituting the fiducial spectra divided by «;».
«Fitting bundles» window
The window Fitting bundles is used for displaying and managing the results of fitting of the reflectance spectra comprising the hypercubes with fiducial spectra (as described in Merzlyak MN (2006) Modeling pigment contributions to spectral reflection of apple fruit Photochem Photobiol Sci 5:748-754 doi:10.1039/b602160c). The fitting is done in the window «Fiducial spectra».
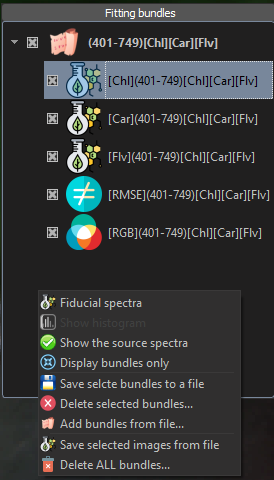
Fitting bundle is a set of 2D arrays of values, the dimensions of each array are the same as pixel dimensions of the source hyperspectral image (hypercube). Each 2D array is actually an index image, each pixel of this image is comprised by the fitting coefficient derived from solving a system of equations. These equations represent the reflectance spectrum associated with a pixel of the hypercube as a sum of spectral contributions of different light-absorbing compounds represented by the fiducial spectra:
these equations are fitted to minimize deviation of the calculated sum of spectral contributions by the fiducial spectra from the source reflectance spectrum:
The 2D distribution of the fitting coefficients
forms the index images constituting the fitting bundle. In addition to this, each fitting bundle contains the values of the root mean square error (RMSE) characterizing the deviation of the model spectrum constructed during the fitting from the measured spectrum in the hypercube. If the fitting is done using three fiducial spectra, the bundle contains also a false-colored RGB image composed from the corresponding index images:
The name of a bundle includes information about the spectral range and the fiducial spectra used for fitting. Name of each index image in the bundle includes the abovementioned information along with the name of specific fiducial spectrum used for deriving of this index image. The name of the RGB image includes [RGB]. The image representing the fitting error (deviation of the modelled spectrum from the measured one) includes [RMSE].
The shortcut menu items for this window:
- «Fiducial spectra» shows the «Fiducial spectra» window.
- «Show histogram» opens the «Histogram» window.
- «Show the source spectra» opens the «Spectrum» window for the measured (source) spectra. The upper part of the window contains tabs with the information about ROI. The tab on the left e.g. contains the name of the devise used for recording of the source data such as «Specim IQ».
- «Show bundle list only» — shows the drop-down list of fitting bundles. Each bundle is a uniquely named set of images, but this option collapses the contents of the bundles so only the names of the bundles are displayed.
- «Save selected bundles to a *.fitting file …» saves selected bundles to a *.fitting file. By default this file is written to the Working folder.
- «Delete selected bundles…» deletes the selected bundles after the confirmation.
- «Add bundles from *.fitting file…» appends the bundles from the selected *.fitting file to the list in the window.
- «Save selected images…» saves the selected images to image files. The formats for saving can be selected
in the dialog, the default folder for saving is the Working folder.
- Delete ALL bundles clears all bundles after confirmation.
«Spectral analysis» window
The window «Spectral analysis” is designed for displaying of the spectra corresponding to the ROIs selected in the «ROIs» window.
The spectra are shown in the upper part of the window along with their legend. Click on a legend item selects the corresponding spectrum.
Different spectral bands in the visible part of the spectrum are highlighted with colors (if highlight is enabled through the options).
This window is updated on selecting a different ROI in the «ROIs» window or after relocating the selected ROI to
different part of the Image in the main window.
The spectra on the plot are scaled and panned with the mouse and/or mouse wheel. Hovering mouse over the spectra opens a tooltip with the name of the spectrum, current wavelength, and the amplitude. Clicking on a spectrum (i) highlights the whole spectrum with bold line and color, (ii) sets the crosswire marker in this point of the spectrum, (iii) drops the values of this point of the spectrum to the corresponding fields of this window:
- the actual wavelength and the amplitude on the left;
- the corrected wavelength for the constructing of spectral indexes on the left;
The crosswire marker can be moved left or right with left or right arrow keys.
Shortcut menu items of the spectra plot:
- Save spectra to image… saves the image of the spectral curves as PDF, PNG, or JPG files located by default in the Working folder.
- Save spectra to Excel *.csv… saves the spectra in numeric form as Excel CSV file located by default
in the Working folder.
- Save ROI to file… saves ROI to a *.roi file located by default in the Working folder.
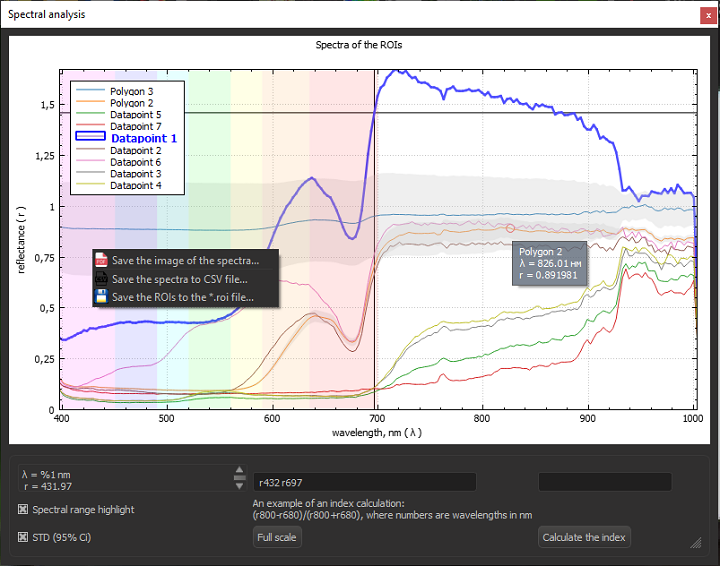
At the bottom of the Spectral analysis window, two mode switches are located (at the left):
- Spectral range highlight;
- Show dispersion (shows the dispersion of the spectra within the ROI around their average values);
At the right, the «Fit to window» button is located (displays whole spectra by fitting them into the window)
together with the field for composing of spectral indexes (holding the sample index formula).
To compose a spectral index, click the desired points of spectra on the graph and complete the formula with the arithmetic operators (« + », « - », « / », « * »).
The resulting formula can be copied to the corresponding field of the Calculate index by the formula window.
You can also directly enter the index formula and name in this window (use the tooltips as a guidance) and
click «Compute index image». The newly computed index image shall be appended to the index image list
in the «Images» window and the false-colored computed image will be overlayed on the current Image in the main window.
«Histogram» window
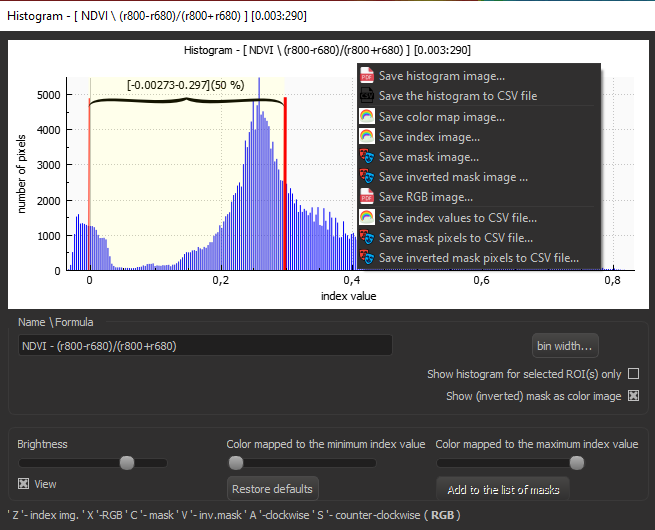
The «Histogrm» window is used for displaying of the histogram for the entire image of the ROI(s) selected in the «Images» window.
In the header of the window, the following information is displayed, for example:
«Histogram - [Difference 833/658 r833-r658][0.004:317]», where
«Difference 833/658» - is a sample index name, «r833-r658» - the sample index formula, «0.004:317» - the class interval and the total number of the classes in the histogram.
In the upper left part of the window, the histogram is displayed with a duplicate header line and vertical lines showing max/min thresholds. These thresholds define the index value range displayed as the index images in the center (area#1, the color map) or at the right (area#2) of the Histogram window.
On hovering over the vertical threshold lines, the mouse pointer changes so you can drag the threshold lines to adjust the clipping limits. These changes are reflected in the numeric labels located above e.g. [-0.107-0.166](24%), where «-0.107-0.166» are the lower and upper limits, and «24%» is the proportion of the total datapoints represented on the histogram within the current limits.
In the left, there is the «Name Formula» set of controls including:
- mask name field (used for saving the mask);
- the checkbox «Show histogram only for selected ROI(s)»—toggles the histogram calculation mode;
- the checkbox «Show color mask/inverted mask»—toggles color vs. black and white mask image modes;
- the «Interval…» button—sets width of the class interval and total number of the classes for the histogram. To check the adjustments, click «Apply», to finish click «ОК»;
- the slider «Brightness» controls brightness of the image shown in the area#2;
- the slider «Min. index color mapping» controls color bar of the image shown in the area#2;
- the slider «Max. index color mapping» controls color bar of the image shown in the area#2;
- the button «Reset» brigs back the default min/max values of the index and shows all datapoints (100%) on the histogram;
- the button «Add to mask list» saves the current mask image (or inverted mask image, if enabled for the area#2 by the option «Mask»/«Inv. mask»);
- Hints on the hotkeys for the area#2 (the keys «Z», «X», «C», «V», «A», «S»);

The shortcut menu items for the histogram:
- Save histogram image… saves the image of the histogram as PNG, JPG, or BMP file written
by default to the Working folder.
- Save histogram as Excel *.csv… saves a numeric representation of the histogram to an Excel *.csv file by default written to the Working folder.
- Save colormap image… saves the false-colored image from the area#1 of the Histogram window as PNG, JPG, or BMP file written by default to the Working folder.
- Save index image… saves the index image from the area#2 of the Histogram window to PDF, PNG, JPG, or BMP file written by default to the Working folder.
- Save mask image… saves the mask image from the area#2 of the Histogram window to PNG, JPG, BMP file written by default to the Working folder.
- Save inv. mask image… saves the inverted mask image from the area#2 of the Histogram window to PNG, JPG, or BMP file written by default to the Working folder.
- Save RGB image… saves the natural-colored image from the area#2 of the Histogram window to PNG, JPG, or BMP file written by default to the Working folder.
- Save index to Excel *.csv… saves the numeric representation of the index image to Excel *.csv file written by default to the Working folder.
- Save mask to Excel *.csv… saves the numeric representation of the mask image to Excel *.csv file written by default to the Working folder.
- Save inv. mask to Excel *.csv… saves the numeric representation of the inverted mask image to Excel *.csv file written by default to the Working folder.
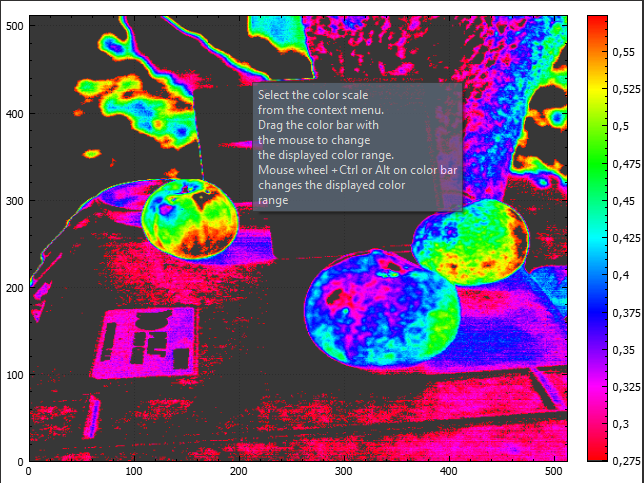
The area#1 displays tooltips with the hints in the color bar using. Dragging the color bar up or down changes the clipping thresholds set of the histogram. Mouse wheel adjusts the threshold interval. Pressing «Alt» or «Shift» when dragging of wheeling the color bar adjusts only upper of lower histogram threshold, respectively.
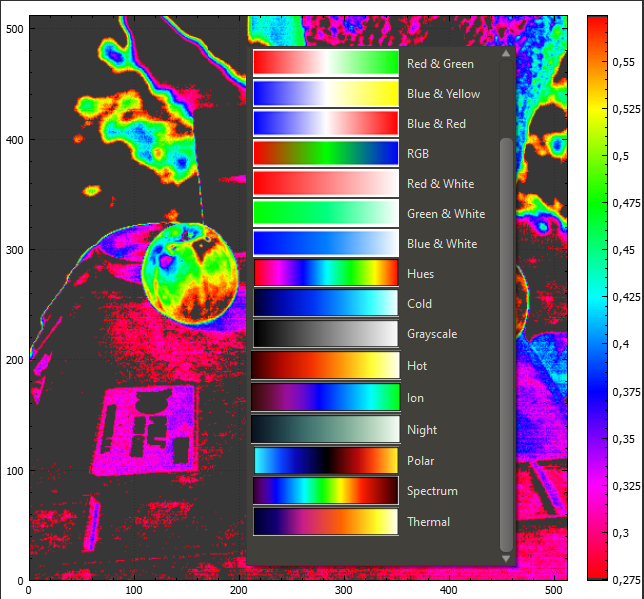
The area#1 also has a shortcut menu for selection of the color mapping scheme for the index image displayed in this area.
The area#2 displays mask images (direct or inverted), index images with adjustable false-color mapping, and natural-colored RGB images. The switching of the display modes is done by the hotkeys «Z», «X», «C», and «V». Rotation of the contents of the area#1 or the area#2 is done by the hotkeys «A» and «S».
Both areas content is scaled/panned synchronously with mouse wheel or dragging.
«Mask image calculator» window
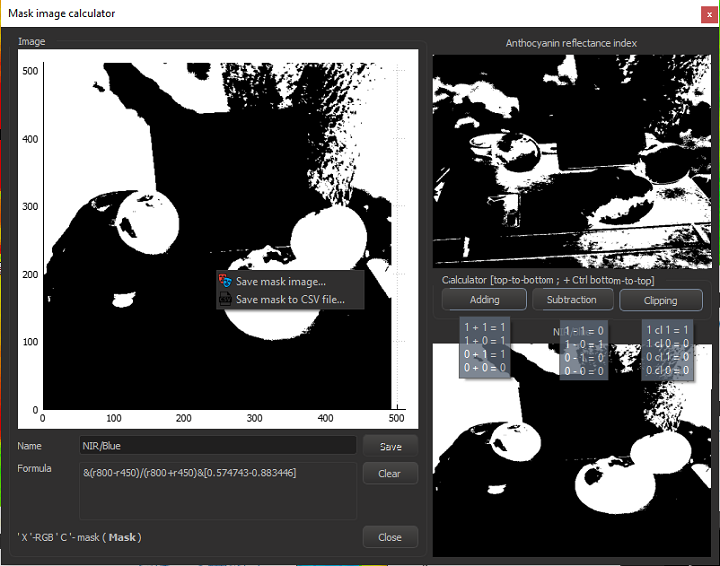
«Mask image calculator» window is used for displaying, input, calculating and output of the mask images.
The input mask images are loaded to the calculator by dragging them from the «Masks» window list of mask images.
In the left part of the window, the field «Images» displays a tooltip имеется. This field displays the either the results of the arithmetic operations on the input masks or RGB-images. The display mode is switched by the «X» or «C» keys.
At the bottom of the window, the field «Name» (for entry of the name for the calculation result)
and the field “Formula” (showing the formula for the calculation of the resulting mask image) are located.
After calculating and naming, the resulting mask image can be save to the «Masks» window by clicking
the «Save” button. To clear the input images, click the «Clear” button.
To close the calculator, click the «Close» button
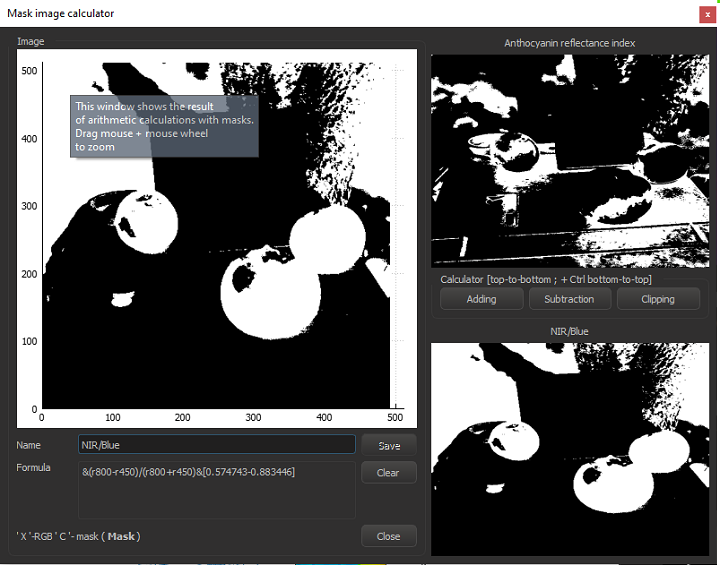
The shortcut menu items for the field «Images»:
- Save mask image… saves the resulting mask image to PNG, JPG, or BMP file written by default to the Working folder.
- Save mask to Excel CSV… saves the numerical representation of the resulting mask image to Excel CSV file written by default to the Working folder.
«Fiducial spectra calculator» window
The «Fiducial spectra calculator» window is used for displaying the fiducial spectra and previews of the fitting operation result.
The displayed fiducial spectra are managed thru the list in the «Fiducial spectra calculator» window.
The fitting bundle is produced for the user-selected fiducial spectra and spectral range. The fiducial spectra are selected in the «Fiducial spectra calculator» window. The spectral range is selected by dragging the vertical lines in the «Fiducial spectra calculator» window.
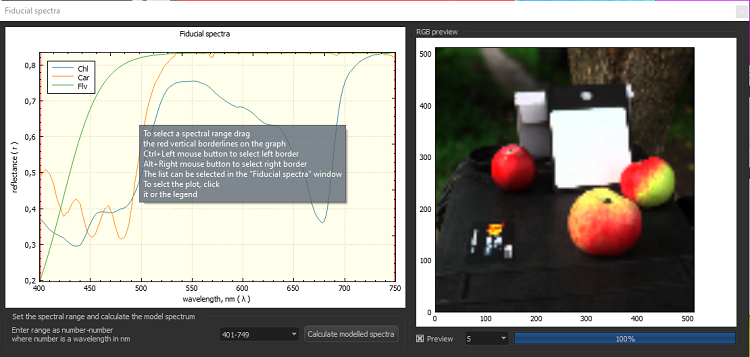
For express selecting the left or right limits of the spectral range, use <Ctrl> + left click or <Alt > + left click.
Click on the legend in the top part of the «Fiducial spectra calculator» filed selects and highlights a fiducial spectrum.
The previously selected spectral ranges can be reused by selecting them from the drop-down list in the middle-bottom part of the window.
Checking «Preview» checkbox enables calculation of the preview for the results of the fitting. The preview quality is selected in the dropdown at the bottom, it ranges from 2 (most precise, slowest) to 10 (most coarse, fastest).
After preview calculation, the list of calculated histograms appears in the top right part of the window. These histograms allow to estimate the quality of the results for specific combination of the fiducial spectra in the particular spectral range. Click on the histogram opens the corresponding index image from the fitting bundle. The “Preview” window can be moved with mouse or zoomed with mouse wheel.
After calculating a preview, a shortcut for image selection from the bundle becomes active.
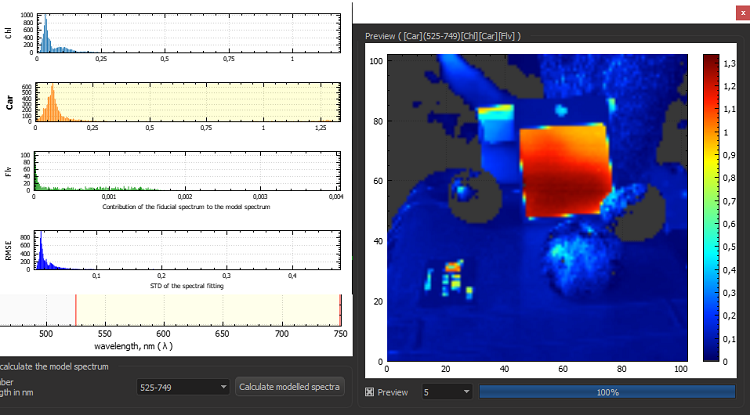
After obtaining a preview of satisfactory quality, you can do the complete calculations by clicking the «Fit» button. When the calculation completes, the resulting fitting bundle will appear in the «Fitting bundles» window and the main image will switch to the RGB mode. Items in the «Fitting bundles» window are directly selectable with the mouse.
The shortcut menu items for the «Fiducial spectra» window:
- Save fiducial spectra image… saves image of the spectral curve plot to PNG, JPG, or PDF file written by default to the Working folder.
- Save fiducial spectra to CSV… saves the numerical representation of the fiducial spectra to Excel *.csv file written by default to the Working folder.
«Mask from ROI» window
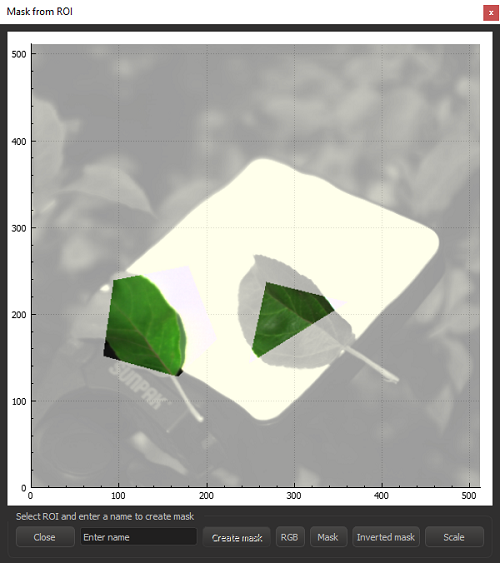
The «Mask from ROI» window is used for creating masks or inverted masks from user-selectable sets of ROI. The ROIs are selected in the`«ROIs» window`_ by checking the corresponding ROI checkboxes.
In the bottom of the window, the name of the mask to be created is displayed. You can drag the image in the center of the window and zoom it with mouse wheel.
Scaling is done with the «Scale» button.
The «RGB» button switches on the colored display of the ROIs, the button «Mask» or «Inv. mask» switches on the black and white display of the ROIs.
The button «Create mask» adds the newly created mask to the mask image list in the «Masks» window .
«ROI from mask» window
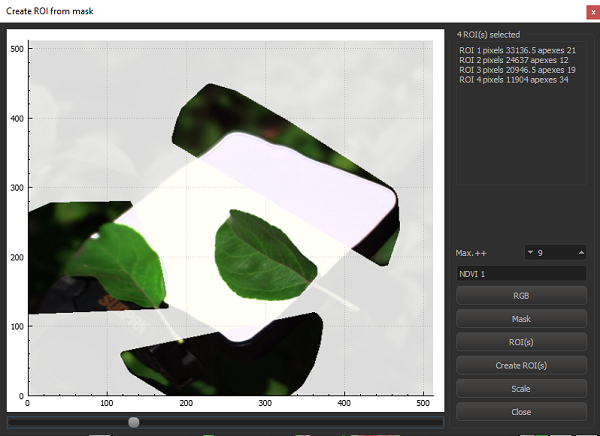
The «ROI from mask» window is used for creating ROIs in the ` main image`_ from mask images.
Scaling is done with the «Scale» button.
The «RGB» button switches on the colored display of the new ROIs
(All the potential ROIs detected on the input mask image are shown).
The button «Mask» switches on the black and white display of the preview of the new ROIs.
(All the potential ROIs detected on the input mask image are shown).
The «ROI» button switches on the colored display of the preview of new ROIs
(The number of displayed ROIs is limited by the setting in the «Max. ROI» field).
The button «Create ROI» adds the newly created ROIs to the Image in the main window .
The slider at the bottom of the window adjusts the selected ROI preserving the large ROIs.
